
Executive summary
The September snapshot places the median published asking price at $30,000, but the more useful finding is the spread: half of qualified records sit between $14,500 and $64,000.
A single market-wide number hides substantial composition effects. Vertical machining centers and CNC lathes account for 72.3% of the indexed listing set. The five most represented manufacturers account for 52.0%. Category, exact model, configuration, condition, control, hours, documentation and removal burden must be considered before any asking price becomes useful value evidence.
Market averages are navigation aids—not appraisals. Category-specific ranges provide a stronger starting point, and machine-specific evidence must do the rest.
What this report covers
Evidence boundary: a listing record is a market observation. It does not establish ownership, authority to sell, condition, accuracy, availability or a completed transaction.
Asking-price distribution
The analytical set includes numeric asking prices from $500 through $5 million. That conservative range excludes obvious placeholders and extreme entries from the numerical summary while retaining industrial equipment at both ends of the market.
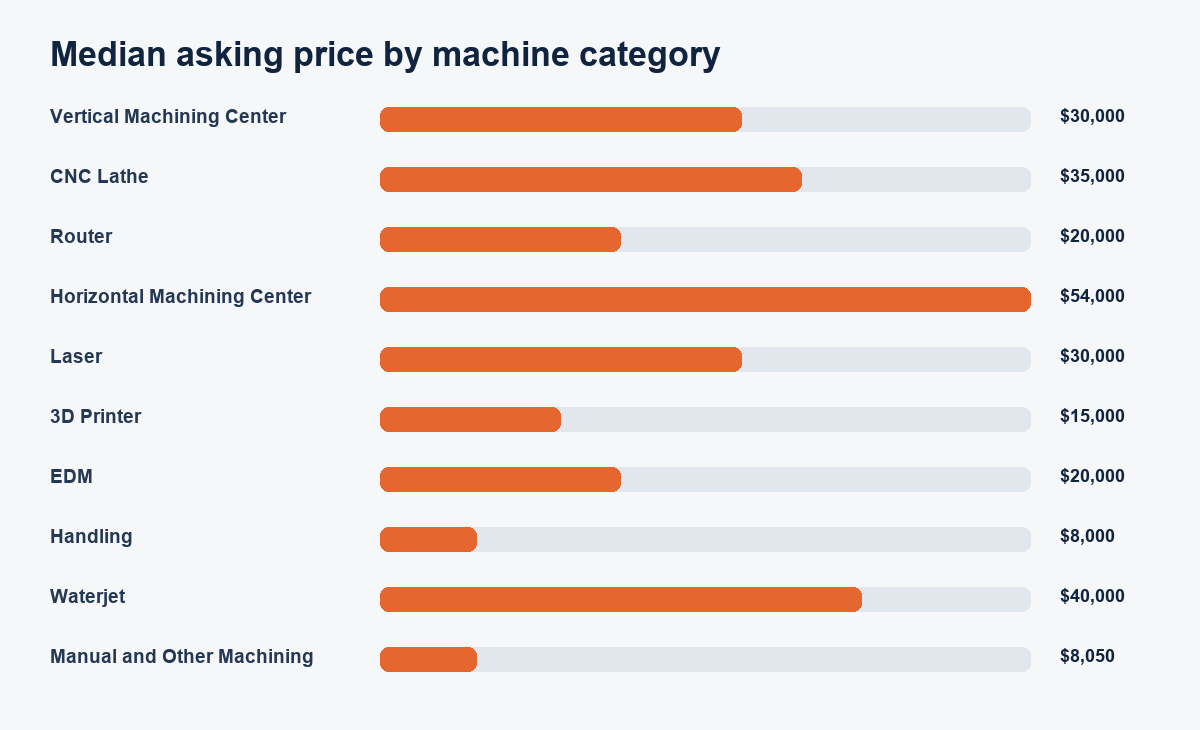
| Equipment category | Listings | Qualified prices | Q1 | Median | Q3 |
|---|---|---|---|---|---|
| Vertical Machining Center | 5,198 | 4,434 | $15,000 | $30,000 | $58,000 |
| CNC Lathe | 4,021 | 3,410 | $17,000 | $35,000 | $75,000 |
| Router | 750 | 671 | $10,000 | $20,000 | $38,000 |
| Horizontal Machining Center | 727 | 629 | $24,000 | $54,000 | $125,000 |
| Laser | 239 | 207 | $12,000 | $30,000 | $99,000 |
| 3D Printer | 192 | 179 | $5,700 | $15,000 | $45,000 |
| EDM | 190 | 156 | $9,375 | $20,000 | $50,000 |
| Handling | 140 | 123 | $3,095 | $8,000 | $25,500 |
| Waterjet | 126 | 113 | $22,300 | $40,000 | $90,000 |
| Manual and Other Machining | 119 | 100 | $5,000 | $8,050 | $14,625 |
| Grinding | 115 | 103 | $11,875 | $24,900 | $66,025 |
| Press Brake | 102 | 90 | $20,000 | $34,500 | $83,670 |
This report is a frozen September 25 analytical set with a disclosed $500 to $5 million price filter. The live Value Center is a separate catalog view with a different record count and may change as catalog records are added or corrected. For example: VMC is $36,750 across 4,295 live priced records versus $30,000 across 4,434 qualified report prices; HMC is $69,900 across 607 versus $54,000 across 629; CNC lathe is $43,900 across 3,265 versus $35,000 across 3,410; and laser is $39,900 across 197 versus $30,000 across 207. These are scope differences, not interchangeable estimates.
Source-mix boundary: the public observation ledger is currently concentrated, with the largest observed source representing 12,765 of 14,194 records (89.9%). The report therefore describes this retained asking-price set, not the entire used-machine market, completed-sale prices or a probability sample. Inspect the public source ledger →
Inventory mix shapes every average
Vertical machining centers are the dominant listing category, followed by CNC lathes. The combined market median therefore reflects that mix; it should not be applied directly to a horizontal machining center, laser, EDM, router or additive system.
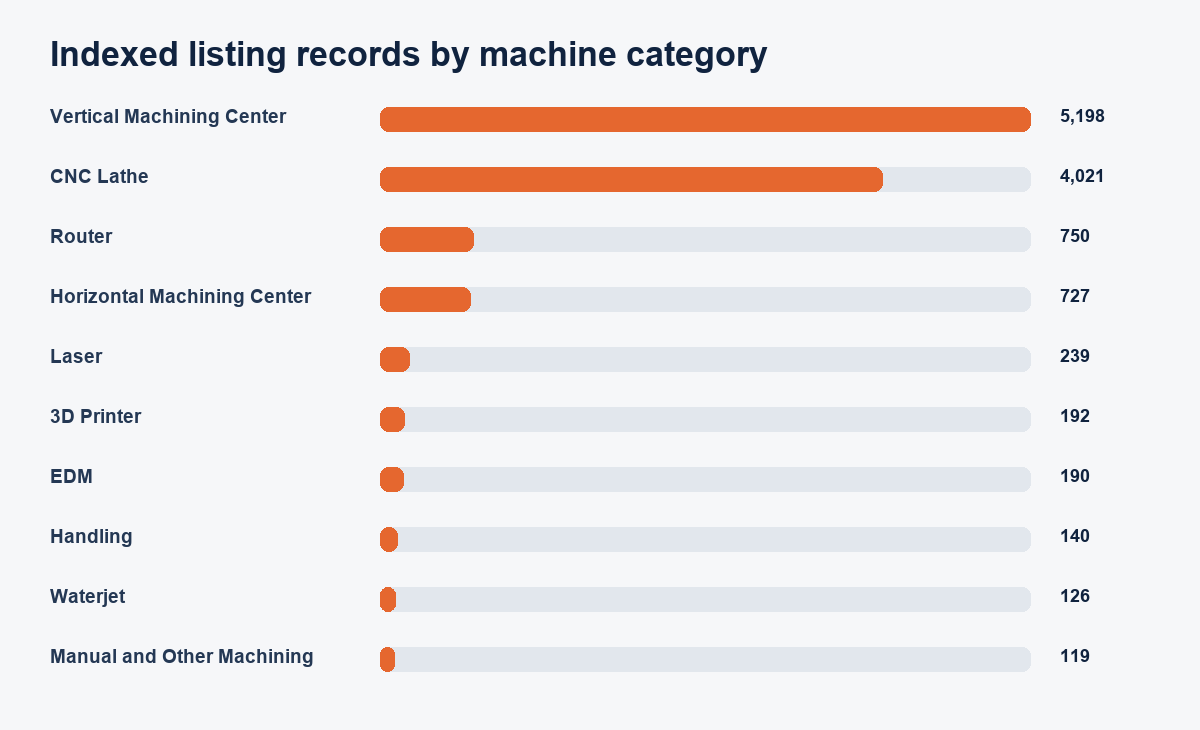
Use the market-wide figure to orient the search. Use the category range to narrow it. Use year, configuration, condition and evidence to evaluate the actual machine.
Manufacturer concentration
The listing pool is not evenly distributed across manufacturers. That matters because manufacturer, model family, control package, parts support and buyer familiarity can all affect asking-price behavior.
| Manufacturer | Listings | Share | Median asking price |
|---|---|---|---|
| Haas | 4,299 | 33.7% | $33,000 |
| Mazak | 972 | 7.6% | $36,500 |
| Doosan | 587 | 4.6% | $70,000 |
| Okuma | 460 | 3.6% | $50,000 |
| Mori Seiki | 313 | 2.5% | $27,500 |
| Fadal | 304 | 2.4% | $10,000 |
| Hurco | 221 | 1.7% | $26,000 |
| Dmg Mori Seiki | 194 | 1.5% | $89,100 |
| Material | 156 | 1.2% | $6,150 |
| Tsugami | 153 | 1.2% | $75,000 |
Counts reflect the indexed records available to MBB at the snapshot date. They do not measure manufacturer market share, shipment volume or installed base.
Machine age is broad—not linear
The record set spans multiple control generations and decades of machine design. Machines built from 2000 through 2019 make up the core of the observed inventory, but age alone cannot explain value.
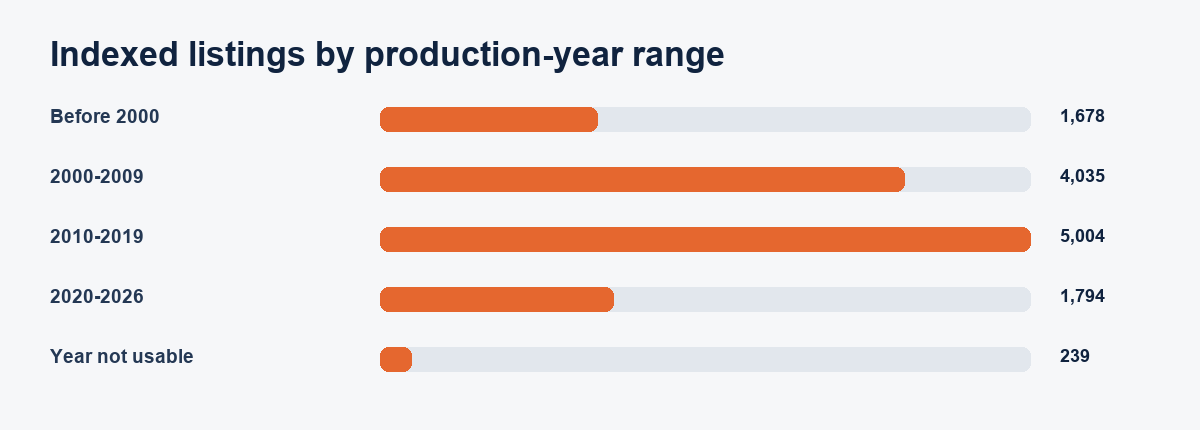
| Production-year band | Listings | Share |
|---|---|---|
| Before 2000 | 1,678 | 13.2% |
| 2000-2009 | 4,035 | 31.6% |
| 2010-2019 | 5,004 | 39.2% |
| 2020-2026 | 1,794 | 14.1% |
| Year not usable | 239 | 1.9% |
Control generation, spindle condition, axis configuration, options, hours, maintenance history, geometry, available service and the cost to remove and restart the asset can outweigh a simple depreciation curve.
2026 manufacturing context
AMT reported that U.S. metalworking machinery orders reached $4.03 billion through July 2026, up 37.1 percent from the same period of 2025. Separately, the U.S. Census Bureau reported August 2026 durable-goods orders were essentially unchanged at $338.6 billion.
Those indicators describe new-order activity and the broader manufacturing economy. They do not determine used-machine transaction values. They provide context for capacity decisions, capital budgets and replacement timing; the MBB asking-price dataset remains a separate evidence layer.
How to use the report
Price the production-ready outcome.
Start with the category range, then account for inspection, freight, rigging, foundation, power, tooling, training, repair and downtime.
Used-machine buying guide →Protect net proceeds.
Separate the advertised figure from commission, fees, removal obligations, payment timing and the amount you actually receive.
Used-machine selling guide →Document the exact machine.
Year is one input. Control, options, hours, maintenance, operating evidence, location and current demand complete the picture.
How machine valuation works →Methodology and limits
MBB analyzed 12,750 indexable listing records from a catalog snapshot built September 25, 2026. 11,855 records carried a positive numeric price. The statistical analysis uses 10,796 asking prices between $500 and $5 million.
Records are not a probability sample of the entire U.S. used-equipment market. Source coverage, listing mix, duplicate commercial exposure, omitted prices and stale listings can bias results. No figure in this report should be treated as a completed-sale price, appraisal, offer, guarantee or investment recommendation.
Cite this report
The Machine Blue Book. “2026 Used CNC Machine Market Report: Asking Prices, Inventory Mix and Value Signals.” September 29, 2026. https://doi.org/10.5281/zenodo.23106776
DOI: 10.5281/zenodo.23106776. Download citation metadata: BibTeX · RIS · CSL JSON · Citation File Format.
Persistent research records: Zenodo · GitHub · Internet Archive.
Charts and report excerpts may be quoted with clear attribution and a link to this report. Contact info@themachinebluebook.com for media questions or a custom aggregate.